
Inim Electronics S.r.l.
VAT: 01855460448
Category: product
Market: Electronic-components
Activity: Security systems and solutions
Company Profile
€ 29.00
Market Multiples
€ 21.00
Shareholders
Leonello Leoni
Rainbow S.r.l. (L. Leoni)
Elisabetta Saini
Baldovino Ruggieri
Other Managers
Board of Directors
Leonello Leoni
Baldovino Ruggieri
Elisabetta Saini
Profit and Loss
| 2020 | 2021 | 2022 | 2023 | |
|---|---|---|---|---|
| Revenues | ****** | ****** | ****** | ****** |
| Changes in stock | ****** | ****** | ****** | ****** |
| Other revenues | ****** | ****** | ****** | ****** |
| Value of production | ****** | ****** | ****** | ****** |
| YoY | ****** | ****** | ****** | |
| Raw materials | ****** | ****** | ****** | ****** |
| Services | ****** | ****** | ****** | ****** |
| Rent and third parties services | ****** | ****** | ****** | ****** |
| Personnel | ****** | ****** | ****** | ****** |
| Other costs | ****** | ****** | ****** | ****** |
| Bad credits | ****** | ****** | ****** | ****** |
| EBITDA | ****** | ****** | ****** | ****** |
| Depreciation | ****** | ****** | ****** | ****** |
| Amortization | ****** | ****** | ****** | ****** |
| EBIT | ****** | ****** | ****** | ****** |
| Financial costs | ****** | ****** | ****** | ****** |
| EBT | ****** | ****** | ****** | ****** |
| Tax | ****** | ****** | ****** | ****** |
| Net result | ****** | ****** | ****** | ****** |
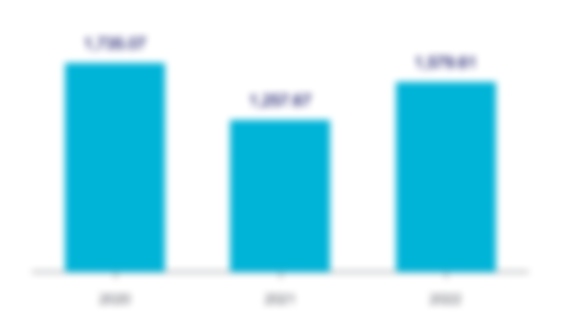
Breakdown Value of Production
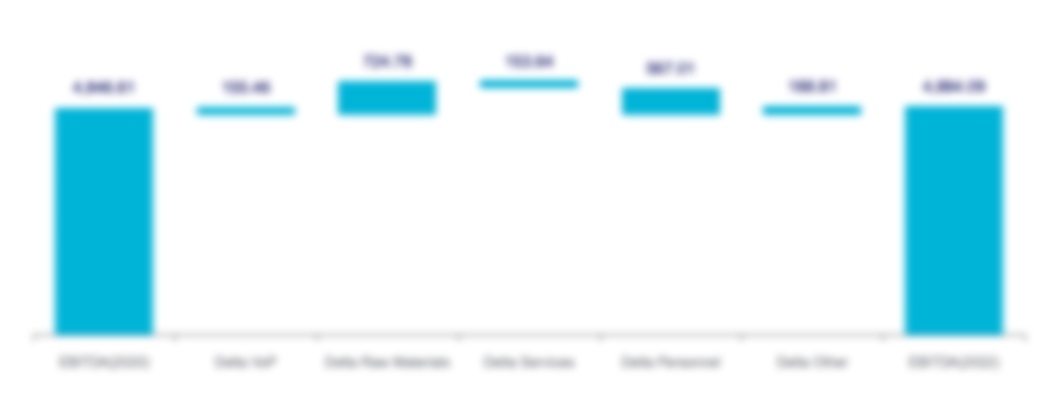
EBITDA Breakdown Graph
Balance Sheet
| 2020 | 2021 | 2022 | 2023 | |
|---|---|---|---|---|
| Inventory | ****** | ****** | ****** | ****** |
| Trade receivables | ****** | ****** | ****** | ****** |
| Trade payables | ****** | ****** | ****** | ****** |
| Operating working capital | ****** | ****** | ****** | ****** |
| Other receivables | ****** | ****** | ****** | ****** |
| Other payables | ****** | ****** | ****** | ****** |
| Working capital | ****** | ****** | ****** | ****** |
| Tangibles | ****** | ****** | ****** | ****** |
| Intangibles | ****** | ****** | ****** | ****** |
| Financial assets | ****** | ****** | ****** | ****** |
| Fixed assets | ****** | ****** | ****** | ****** |
| Provisions | ****** | ****** | ****** | ****** |
| NET INVESTED CAPITAL | ****** | ****** | ****** | ****** |
| Cash | ****** | ****** | ****** | ****** |
| Financial Debt LT | ****** | ****** | ****** | ****** |
| Financial Debt ST | ****** | ****** | ****** | ****** |
| NFP (cash) | ****** | ****** | ****** | ****** |
| Share capital | ****** | ****** | ****** | ****** |
| Reserves | ****** | ****** | ****** | ****** |
| Net result | ****** | ****** | ****** | ****** |
| Net equity | ****** | ****** | ****** | ****** |
| FINANCIAL SOURCES | ****** | ****** | ****** | ****** |
Cash Flow
| 2020 | 2021 | 2022 | 2023 | |
|---|---|---|---|---|
| EBITDA | ****** | ****** | ****** | ****** |
| Tax | ****** | ****** | ****** | ****** |
| Nopat | ****** | ****** | ****** | ****** |
| Delta Working capital | ****** | ****** | ****** | |
| Delta Investments | ****** | ****** | ****** | |
| Delta Provisions | ****** | ****** | ****** | |
| Operating Cash Flows | ****** | ****** | ****** | |
| Delta Net Equity | ****** | ****** | ****** | |
| Financials | ****** | ****** | ****** | |
| Free Cash Flow | ****** | ****** | ****** |
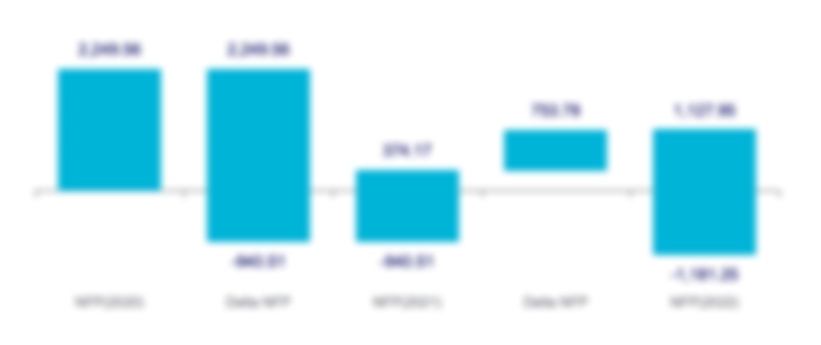
NFP Trend Graph

Are you looking for a custom report on a selected SME?
Contact usFind a Report
Search by name, VAT or market.