Teoresi S.p.A.
VAT: 03037960014
Category: service
Market: Engineering
Activity: Engineering and R&D Services
Company Profile
€ 29.00
Market Multiples
€ 21.00
Shareholders
Enzo Brasso
Treasury Shares
Amahoro S.r.l. (Valter Brasso)
Moschini S.p.A. (Moschini family)
Board of Directors
Valter Brasso
Mario Moiso
Antonella Tornavacca
Giulia Mosconi
Alberto Dal Poz
Daniele Lucà
Profit and Loss
| 2019 | 2020 | 2021 | 2022 | |
|---|---|---|---|---|
| Revenues | ****** | ****** | ****** | ****** |
| Changes in stock | ****** | ****** | ****** | ****** |
| Other revenues | ****** | ****** | ****** | ****** |
| Value of production | ****** | ****** | ****** | ****** |
| YoY | ****** | ****** | ****** | |
| Raw materials | ****** | ****** | ****** | ****** |
| Services | ****** | ****** | ****** | ****** |
| Rent and third parties services | ****** | ****** | ****** | ****** |
| Personnel | ****** | ****** | ****** | ****** |
| Other costs | ****** | ****** | ****** | ****** |
| Bad credits | ****** | ****** | ****** | ****** |
| EBITDA | ****** | ****** | ****** | ****** |
| Depreciation | ****** | ****** | ****** | ****** |
| Amortization | ****** | ****** | ****** | ****** |
| EBIT | ****** | ****** | ****** | ****** |
| Financial costs | ****** | ****** | ****** | ****** |
| EBT | ****** | ****** | ****** | ****** |
| Tax | ****** | ****** | ****** | ****** |
| Net result | ****** | ****** | ****** | ****** |
Breakdown Value of Production

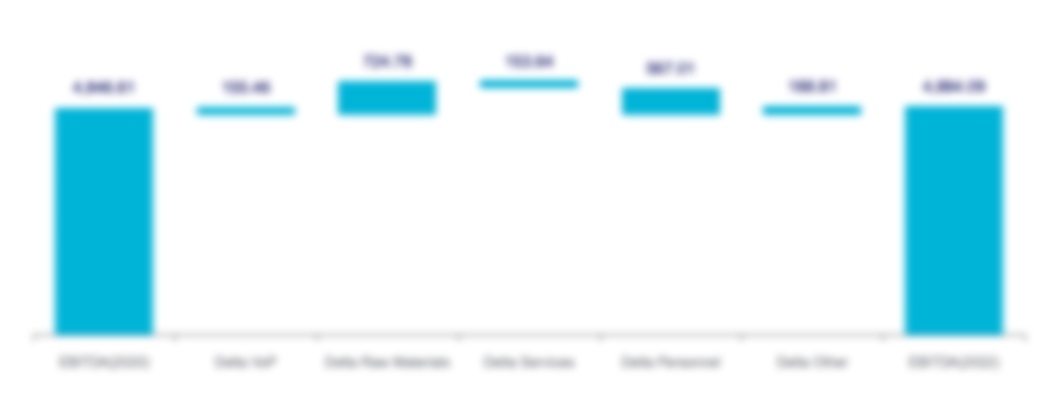
EBITDA Breakdown Graph

Balance Sheet
| 2019 | 2020 | 2021 | 2022 | |
|---|---|---|---|---|
| Inventory | ****** | ****** | ****** | ****** |
| Trade receivables | ****** | ****** | ****** | ****** |
| Trade payables | ****** | ****** | ****** | ****** |
| Operating working capital | ****** | ****** | ****** | ****** |
| Other receivables | ****** | ****** | ****** | ****** |
| Other payables | ****** | ****** | ****** | ****** |
| Working capital | ****** | ****** | ****** | ****** |
| Tangibles | ****** | ****** | ****** | ****** |
| Intangibles | ****** | ****** | ****** | ****** |
| Financial assets | ****** | ****** | ****** | ****** |
| Fixed assets | ****** | ****** | ****** | ****** |
| Provisions | ****** | ****** | ****** | ****** |
| NET INVESTED CAPITAL | ****** | ****** | ****** | ****** |
| Cash | ****** | ****** | ****** | ****** |
| Financial Debt LT | ****** | ****** | ****** | ****** |
| Financial Debt ST | ****** | ****** | ****** | ****** |
| NFP (cash) | ****** | ****** | ****** | ****** |
| Share capital | ****** | ****** | ****** | ****** |
| Reserves | ****** | ****** | ****** | ****** |
| Net result | ****** | ****** | ****** | ****** |
| Net equity | ****** | ****** | ****** | ****** |
| FINANCIAL SOURCES | ****** | ****** | ****** | ****** |
Cash Flow
| 2019 | 2020 | 2021 | 2022 | |
|---|---|---|---|---|
| EBITDA | ****** | ****** | ****** | ****** |
| Tax | ****** | ****** | ****** | ****** |
| Nopat | ****** | ****** | ****** | ****** |
| Delta Working capital | ****** | ****** | ****** | |
| Delta Investments | ****** | ****** | ****** | |
| Delta Provisions | ****** | ****** | ****** | |
| Operating Cash Flows | ****** | ****** | ****** | |
| Delta Net Equity | ****** | ****** | ****** | |
| Financials | ****** | ****** | ****** | |
| Free Cash Flow | ****** | ****** | ****** |
NFP Trend Graph

Are you looking for a custom report on a selected SME?
Contact usFind a Report
Search by name, VAT or market.
